You know the feeling. Two dashboards, two different show rates. A month that looked strong in the CRM but came in thin at the bank. A rep swears their number is wrong and you can't prove it either way, because the report only reaches back so far and the export stopped at ten thousand rows.
You're not bad at reporting. You're running it on a tool that was never built to remember.
GHL is an operations tool wearing a reporting costume
GoHighLevel is very good at its real job: booking calls, firing workflows, pushing deals down a pipeline. That's the doing. Reporting is a different job. It means remembering what happened and explaining it the same way twice, and GHL treats that as an afterthought. The result is three specific lies.
The first lie: "this is all your data"
It isn't. GHL's attribution export stops at ten thousand records. Go past that and the report you hand a client or your boss is quietly missing rows, with nothing on screen to warn you. That cap limits the screen, not your data.
The second lie: "this is what happened"
GHL keeps the present, not the past. When a deal changes stage, an appointment flips from showed to no-show, or a record gets deleted, the old value is written over. A cancelled-then-rebooked call ends up looking like it was always booked. A timezone quirk files a lead under the wrong day and the daily totals never quite add up. Your history isn't stored anywhere. It's replaced.
The third lie: "this number means what you think it means"
Ask three dashboards for your show rate and you can get three answers, because each one counts it a little differently. When the definition lives inside every chart instead of in one shared place, they drift apart.
None of this means GHL is broken. A CRM has a short memory by design. It's tuned to run today, not to explain last quarter.
The fix: a reporting layer that reads GHL and never touches it
You don't replace the CRM. You give it the memory and the math it never had: a thin layer that sits behind it and does the telling, while GHL keeps doing. Six things make it trustworthy.
- It reads everything through the API, so there's no ten-thousand-row wall. A scheduled sync pulls contacts, appointments, opportunities, calendars, reps, and conversations straight from GHL on a timer. The export cap is a limit in the interface, not the API, and the API returns every row the screen won't. New pipelines, tags, reps, and calendars show up on their own, with nothing to rebuild.
- The sync is strictly read only. It reads and does nothing else, so it can't edit, delete, or overwrite a single CRM record. The reporting layer can never corrupt the thing it reports on, and your operations and your analytics stay cleanly apart.
- It keeps the history GHL throws away. Every record is copied into a durable warehouse, so stage changes, status flips, and deletions all survive. You can query years of it in plain SQL, and a CRM outage never takes your reporting down with it. The warehouse becomes the memory the CRM doesn't keep.
- Every metric is defined once. Show rate, close rate, the cohort funnel, commissions: each has a single written definition that every chart reads from. Two dashboards can't disagree when there's only one place the answer comes from.
- Reps see only their own numbers. The same dashboard serves an admin who sees everything and a rep who sees only their own appointments, deals, and commission. That rule lives in the database, not just the interface, so a rep can't pull another rep's row even if they try.
- It's a web app, not another per-seat licence. You open it at a URL. There are no per-user fees like the ones Tableau or Power BI or Looker charge, so adding a viewer costs nothing. Reads hit the warehouse instead of the CRM, so pages load fast and never rate-limit GHL.
The whole thing is cheap to run and hard to break, because a read-only, static tool has very little to secure. If you want the technical detail of the sync side, I've written up exactly how the GHL-to-Supabase export works.
What it puts in front of you
The whole sales motion, on a handful of pages that agree with each other.
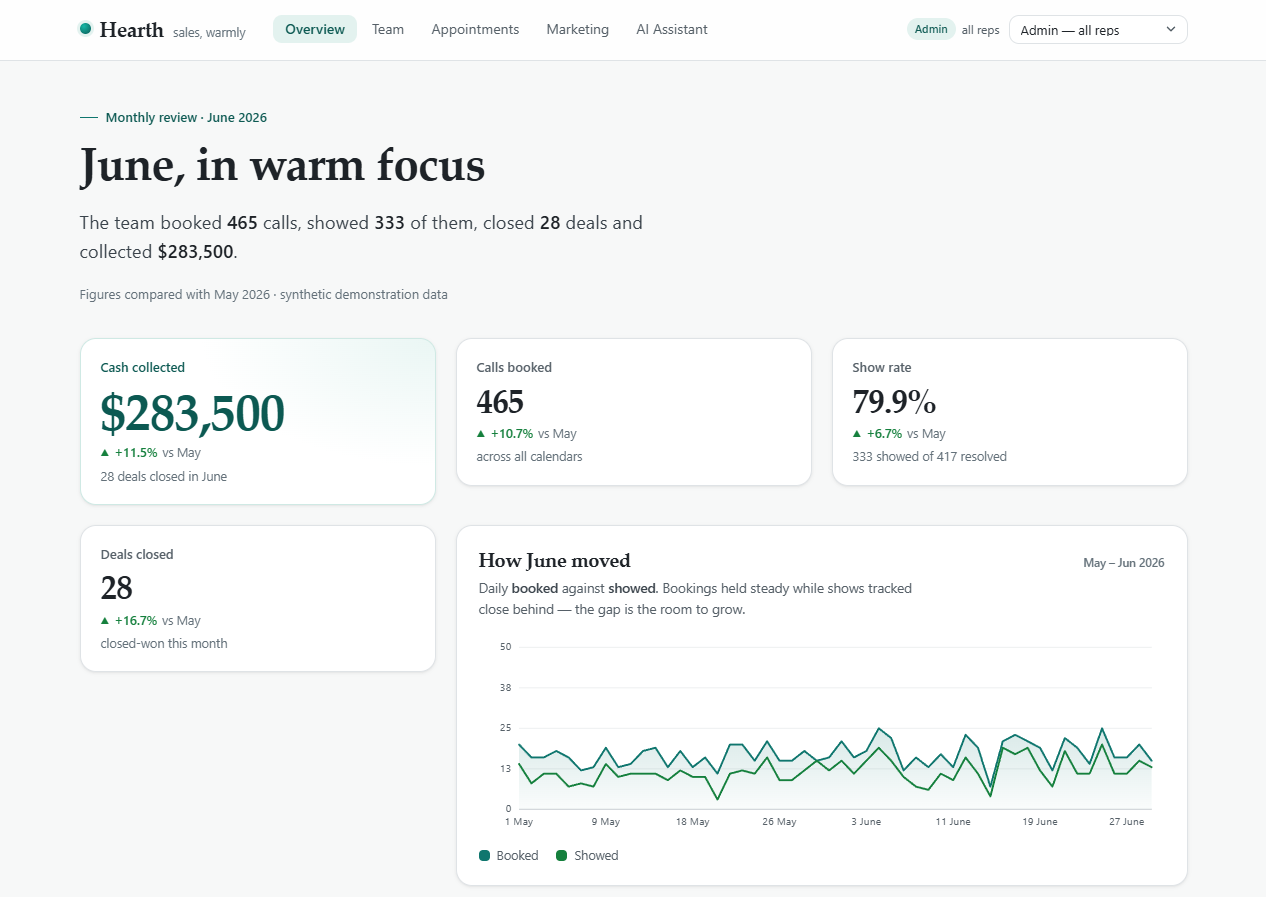
- Appointments: booked, showed, no-show, cancelled, pending, and a show rate you can trust, sliced by calendar and by rep.
- Reps: closer and setter mix, close rates, cash against contract, and commissions worked out from the cash that was collected.
- A cohort funnel that runs first call, showed, admission, showed, closed, revenue, crediting each lead to the month it started, so a March close from a January call still counts in January.
- The AI assistant: conversations, replied, qualified, booked, showed, closed, so you can see what the bot is really earning.
- Your audience: where leads come from, who they are, and where they are.
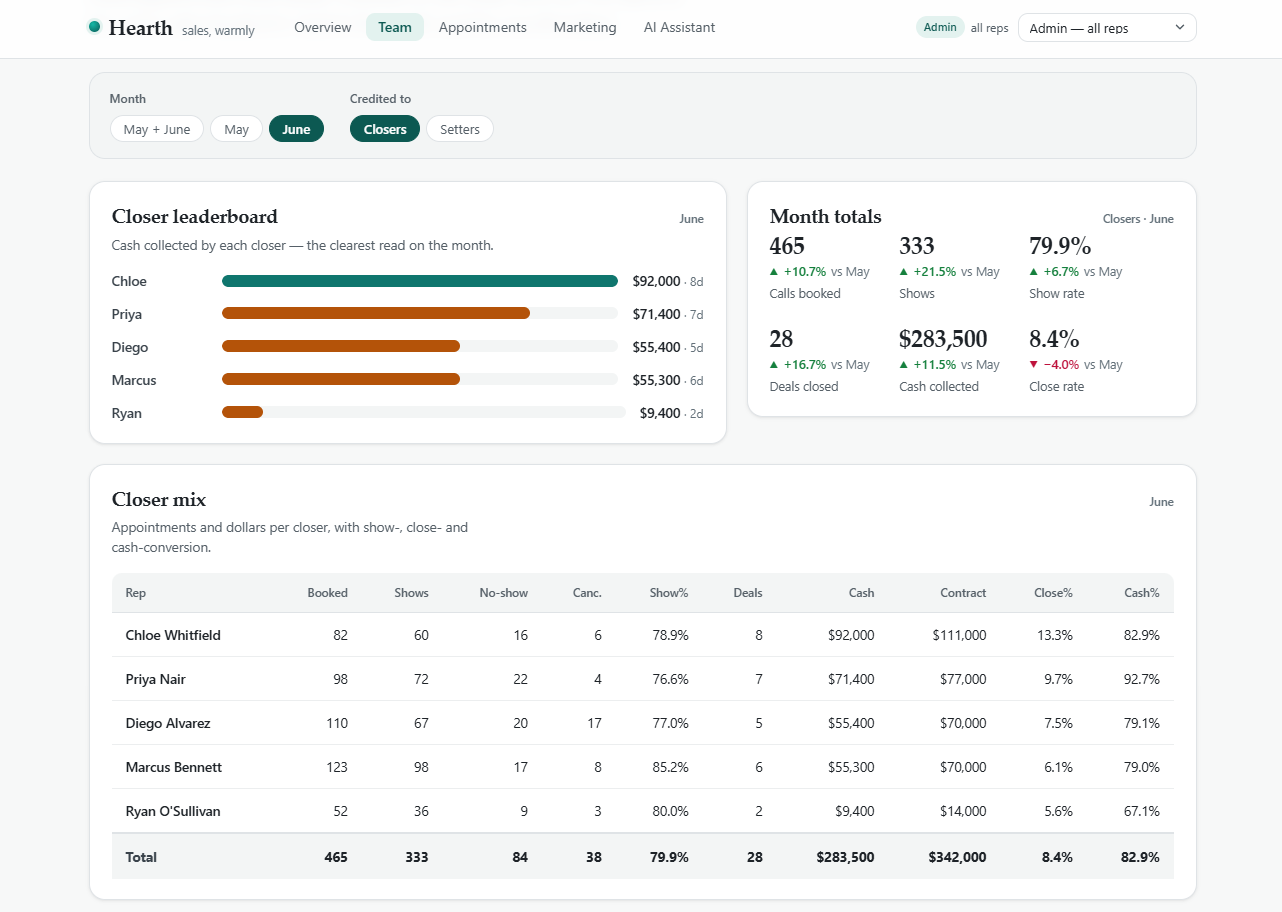
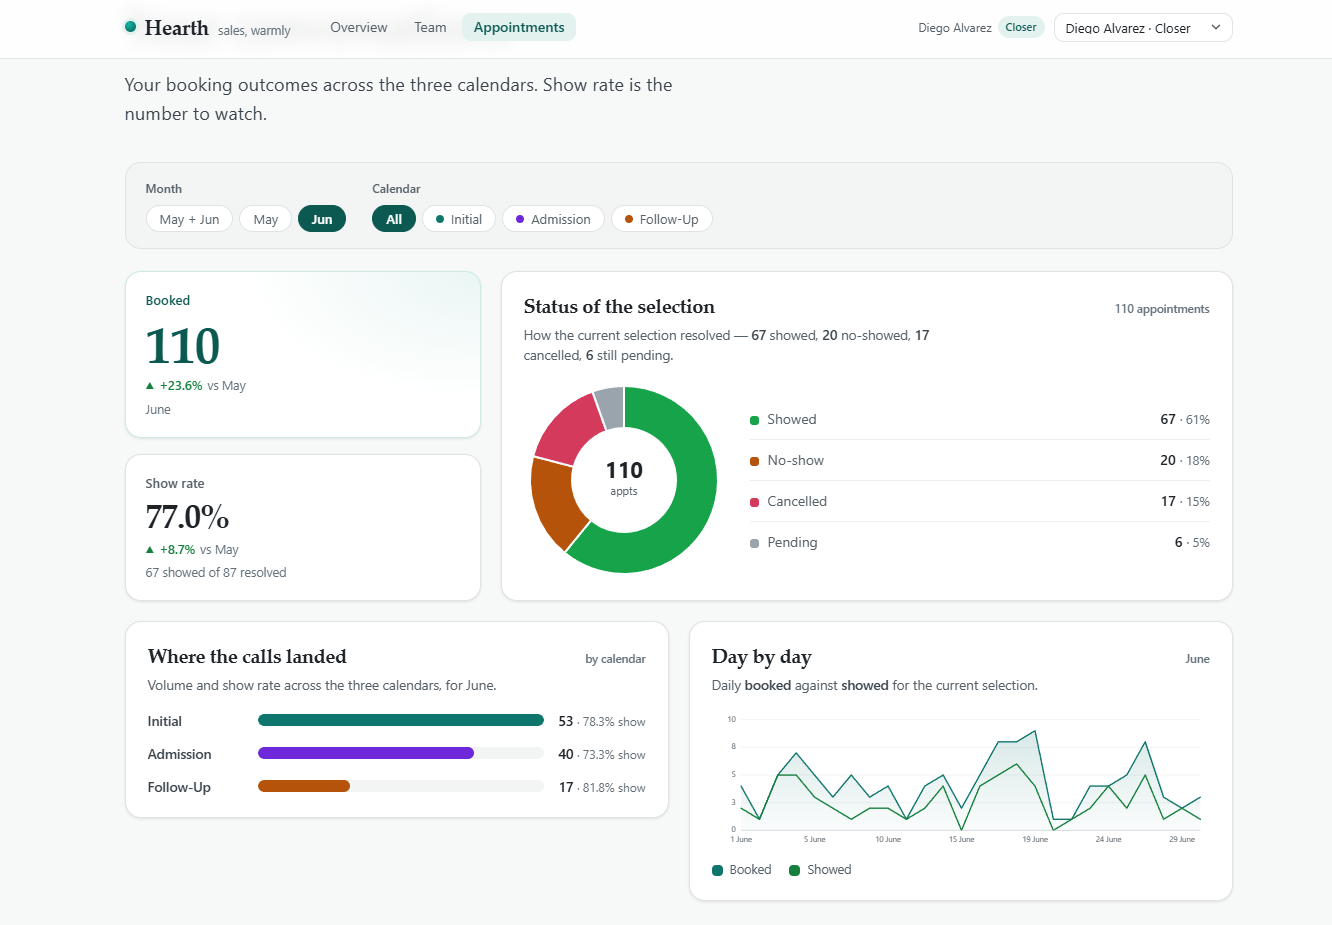
Every figure is worked out from the raw appointment and deal rows, with month-on-month changes built in. The tiles, the tables, and the totals can't drift apart, because they're all reading the same rows.
Don't take the screenshots' word for it. The dashboard above is live, running on synthetic demo data: click around the real thing — the overview, team, appointments, marketing, and AI pages are all there.
The look comes last
Most people get this backwards. The reporting engine is the fixed part: the sync, the warehouse, one definition per metric. The presentation is just a skin over it. The same data can come out as a calm monthly review, a mission-control wall, a keynote deck, or a trading-terminal grid. You pick whichever fits your brand, and the numbers underneath stay exactly the same.
Want to see where yours is lying?
Send me your GHL account, yours or a client's, and I'll point out three places your current reporting is quietly wrong: an export that's been truncated, a metric that drifts, a stretch of history that's already been written over. No pitch and no obligation, just a straight look at your own numbers, told properly for once.
Book the 20-minute reporting teardown, or read more about the data-ops work I do for marketing agencies.