Marketing agencies often run their sales process inside GoHighLevel, but the reporting usually ends up somewhere else.
Appointments are booked in the CRM. Sales stages move through the pipeline. Setters and diallers need credit. Managers need to know who closed what. Ad spend needs to be compared against revenue. Then, at the end of the week, someone still opens Google Sheets or Excel and starts copying data around manually.
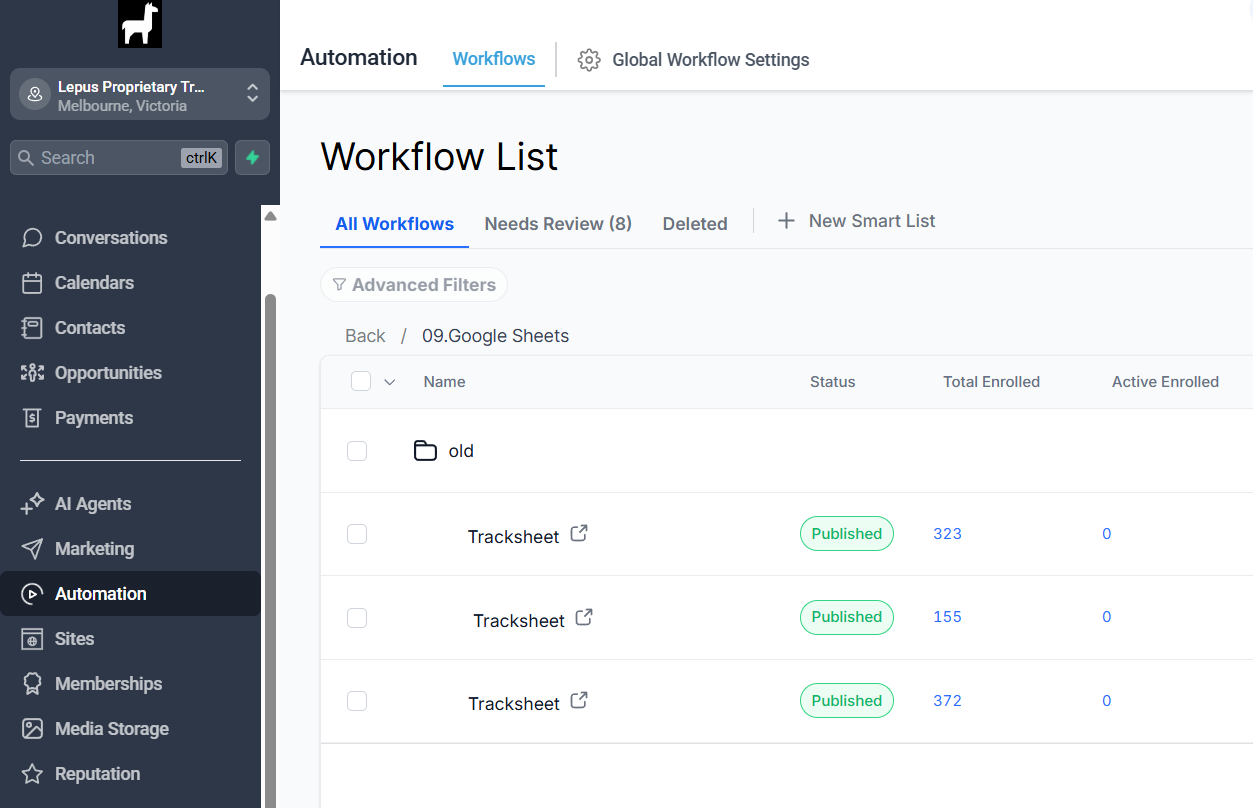
This project solved that problem by connecting a GoHighLevel workflow to a live Google Sheets tracker. The automation captures appointment outcomes, pipeline movement, sales values, payment details, setter activity, and close data so the agency can build reporting and commission calculations from one structured sheet.
The Problem: Agency Sales Data Was Too Manual
The agency needed a reliable way to track lead and sales outcomes without asking the team to update a spreadsheet by hand after every appointment or pipeline change.
- Appointment outcomes were scattered across GHL views.
- Show, no-show, confirmed, hot, and closed statuses were hard to compare in one place.
- Sales reps, setters, and diallers needed cleaner performance tracking.
- Contract value and cash collected needed to flow into reporting.
- Commission calculations depended on clean sales data.
- Revenue needed to be compared against ad spend to understand campaign performance.
- Manual spreadsheet updates were too slow and too easy to miss.
The goal was not just to send data to a sheet. The real goal was to create a reporting layer that could support sales dashboards, rep scorecards, commission calculations, and ad spend analysis.
The Goal: A Live Tracker for Appointments, Sales, Commissions, and Ad Spend
The system needed to update a Google Sheet whenever important sales activity happened in GoHighLevel.
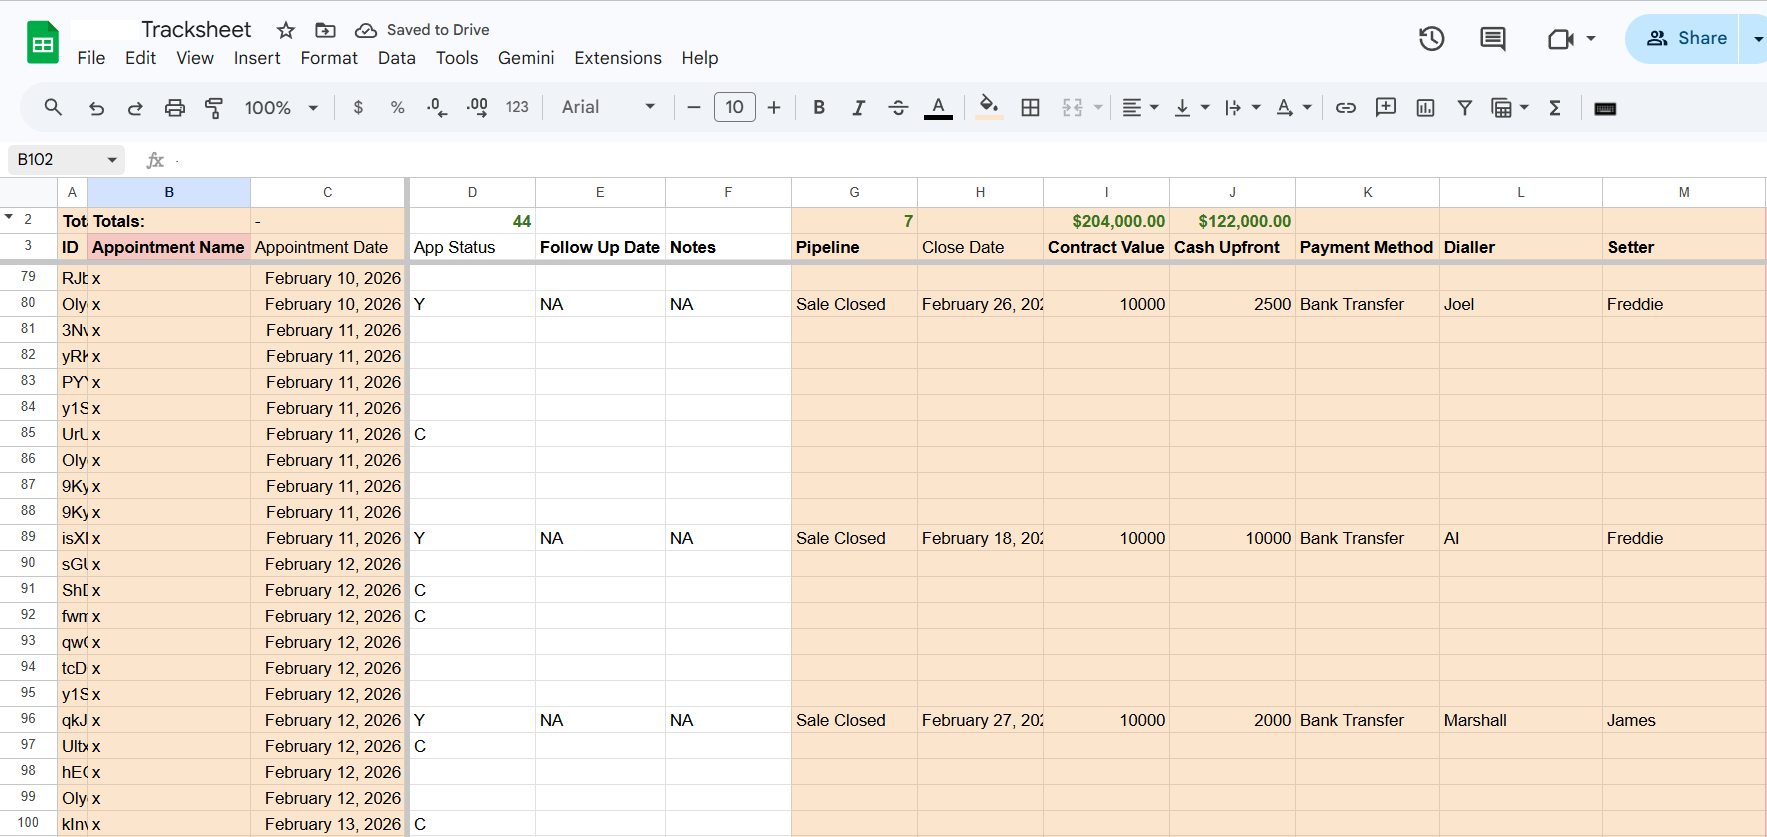
The tracker was designed to capture contact ID, appointment name, appointment date, appointment status, follow-up date, notes, pipeline stage, close date, contract value, cash collected upfront, payment method, dialler, and setter.
From there, the sheet could support a management dashboard showing revenue by sales rep, cash collected by rep, commission owed by rep, show rate, no-show rate, closed deals by pipeline stage, return on ad spend, cost per appointment, and cost per closed deal.
The Solution: GHL Workflow Plus Google Sheets Lookup Row
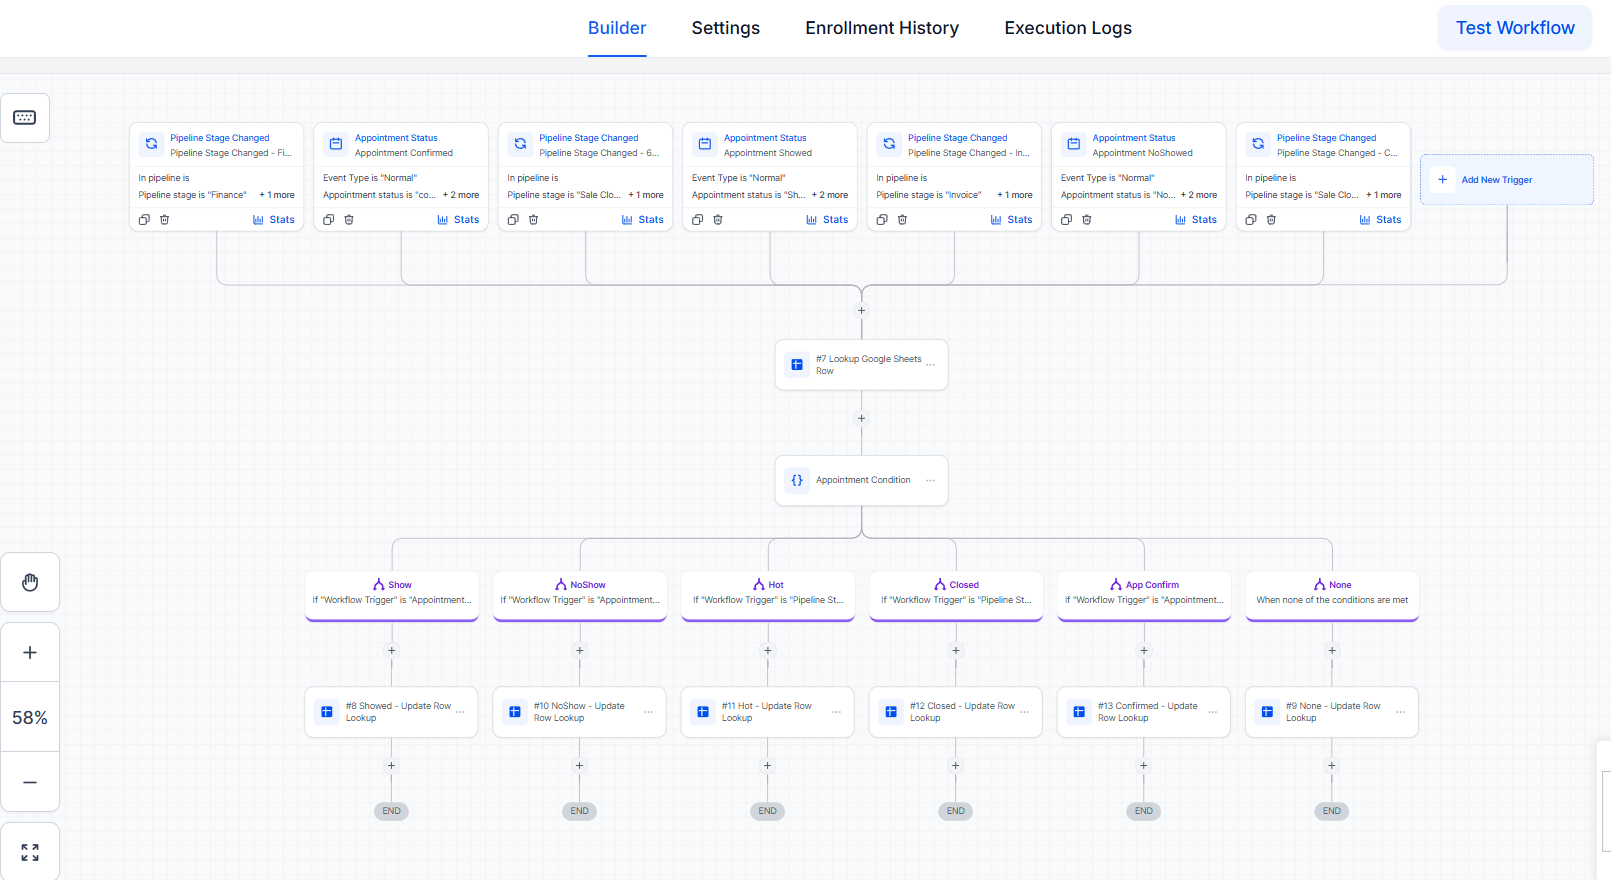
The final workflow used multiple GoHighLevel triggers, a Google Sheets lookup step, conditional branches, and update-row actions.
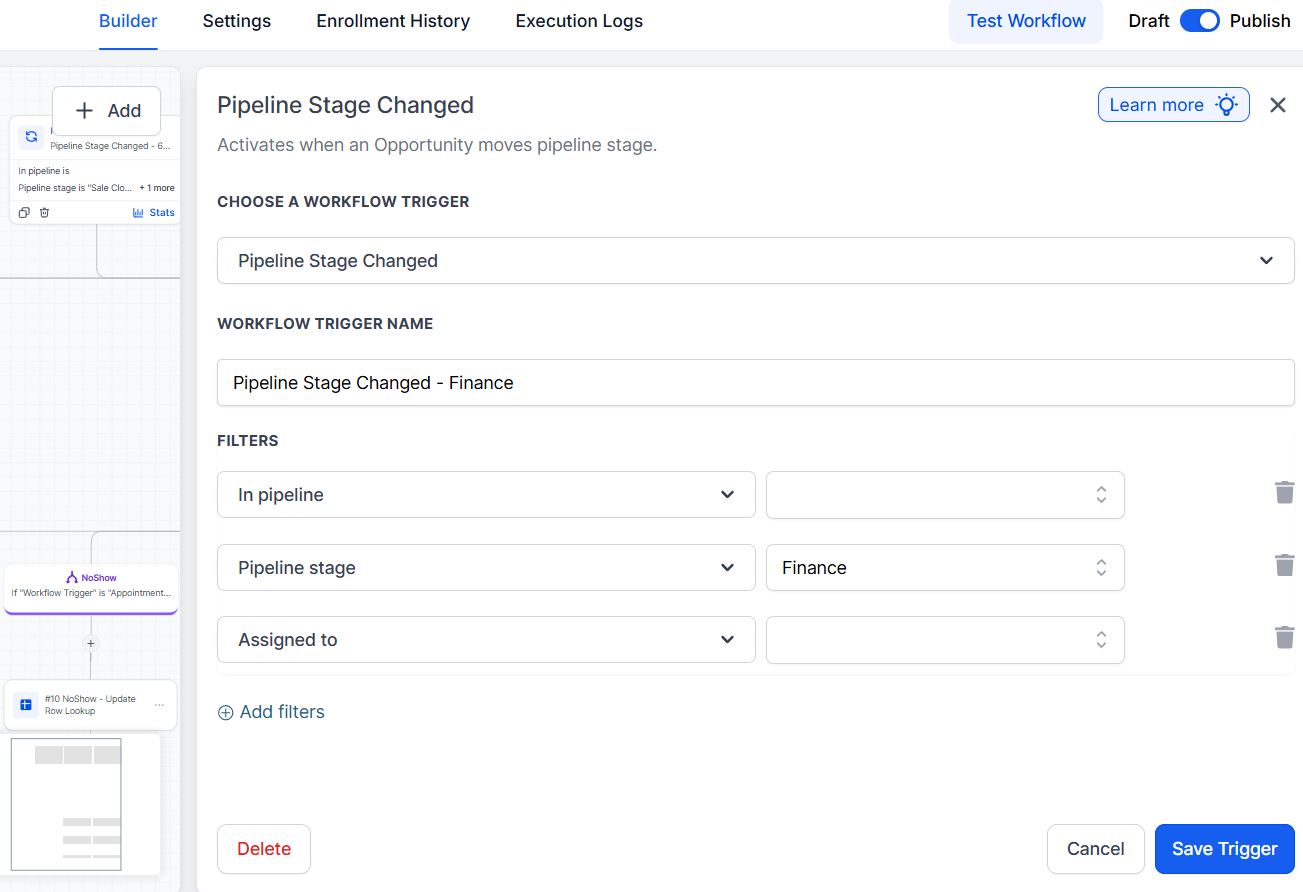
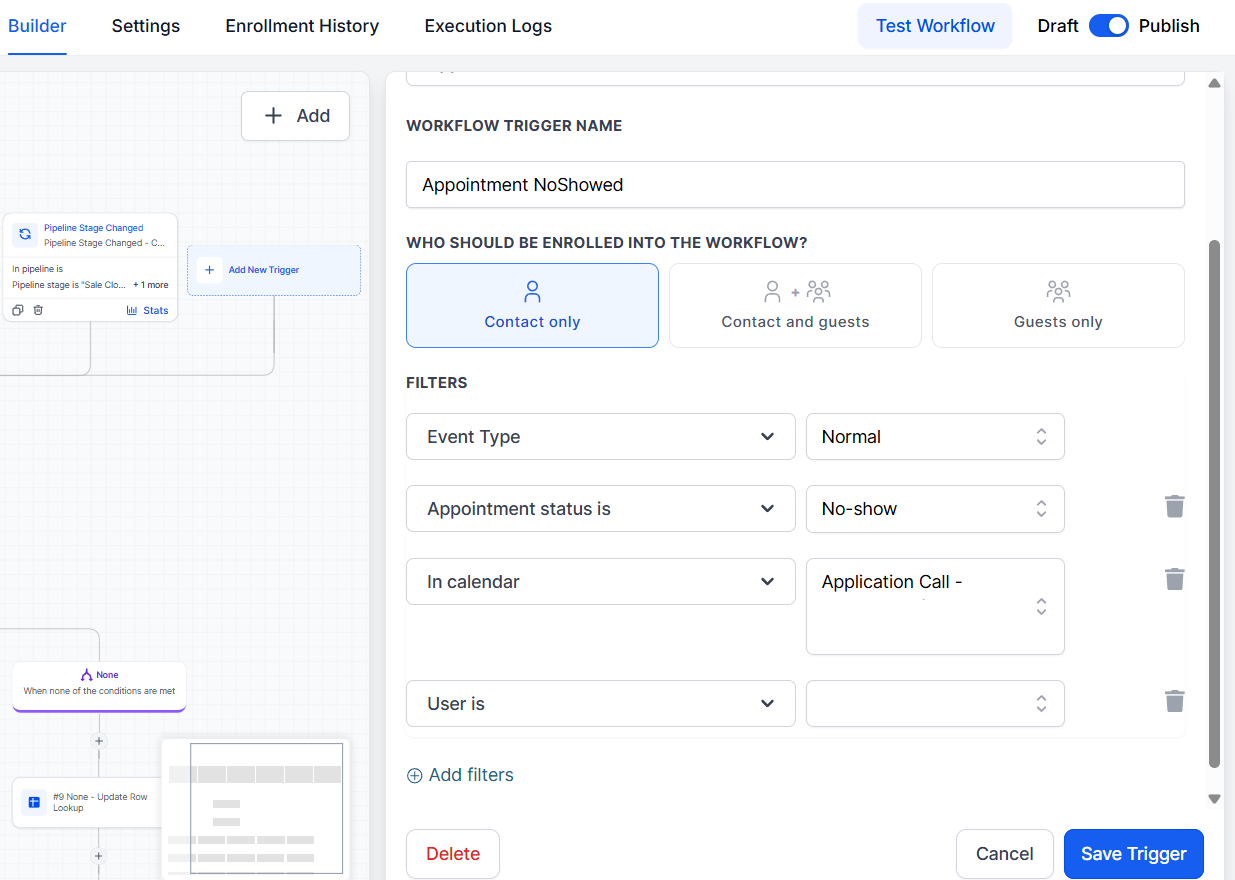
The workflow listens for events such as pipeline stage changes, appointment confirmations, appointment showed status, no-show status, hot lead movement, and closed sales.
- Identify the contact.
- Look up the matching row in Google Sheets using the contact ID.
- Create a row if one does not already exist.
- Check which event triggered the workflow.
- Update only the relevant columns for that event.
- Leave the rest of the row intact for future updates.
This design matters because a sales journey happens in steps. The same contact may first book an appointment, later show up, then become hot, then close. The sheet needs one evolving row per contact, not a new duplicate row every time something changes.
Why the Lookup Row Step Mattered
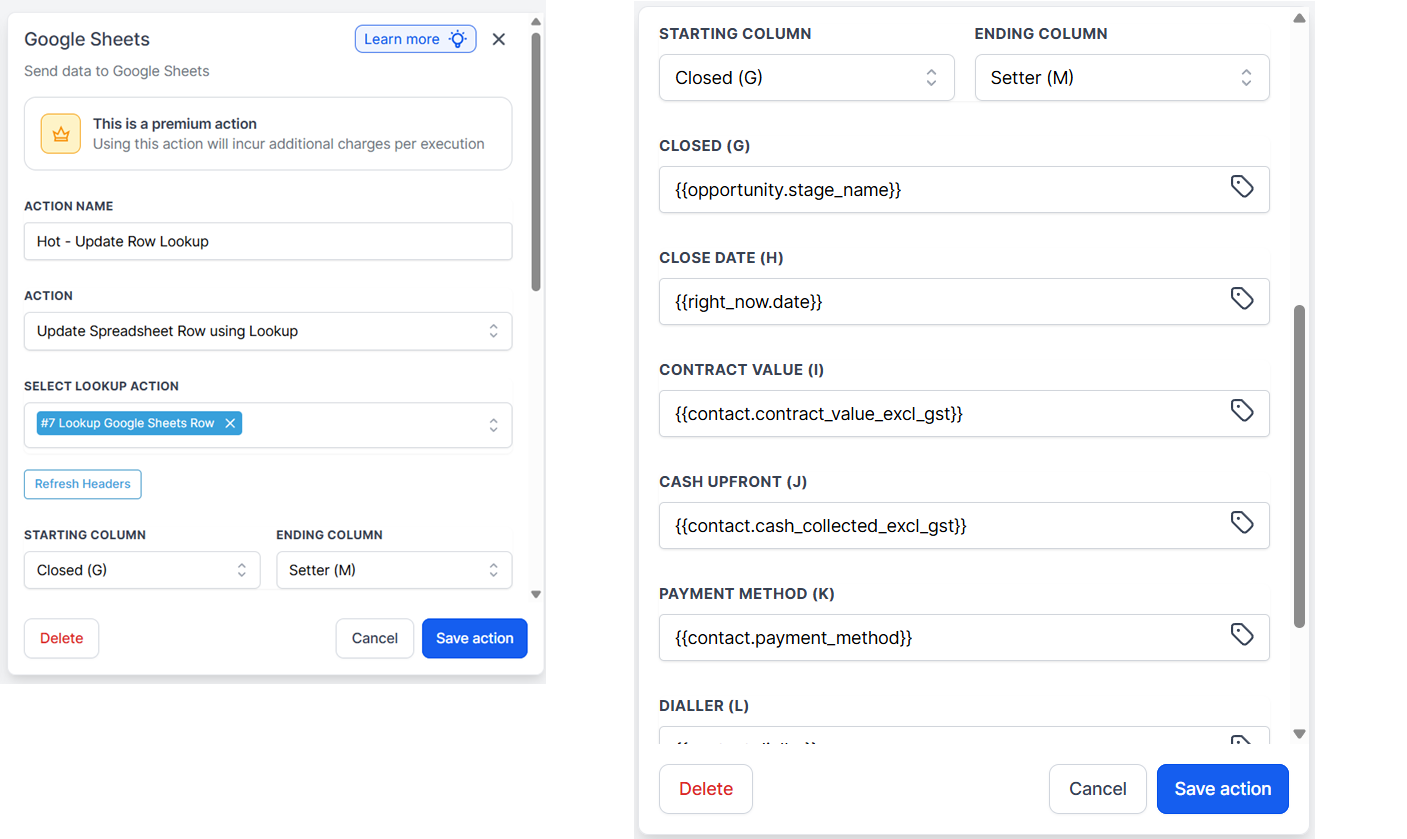
The most important part of this workflow was the Google Sheets Lookup Spreadsheet Row action.
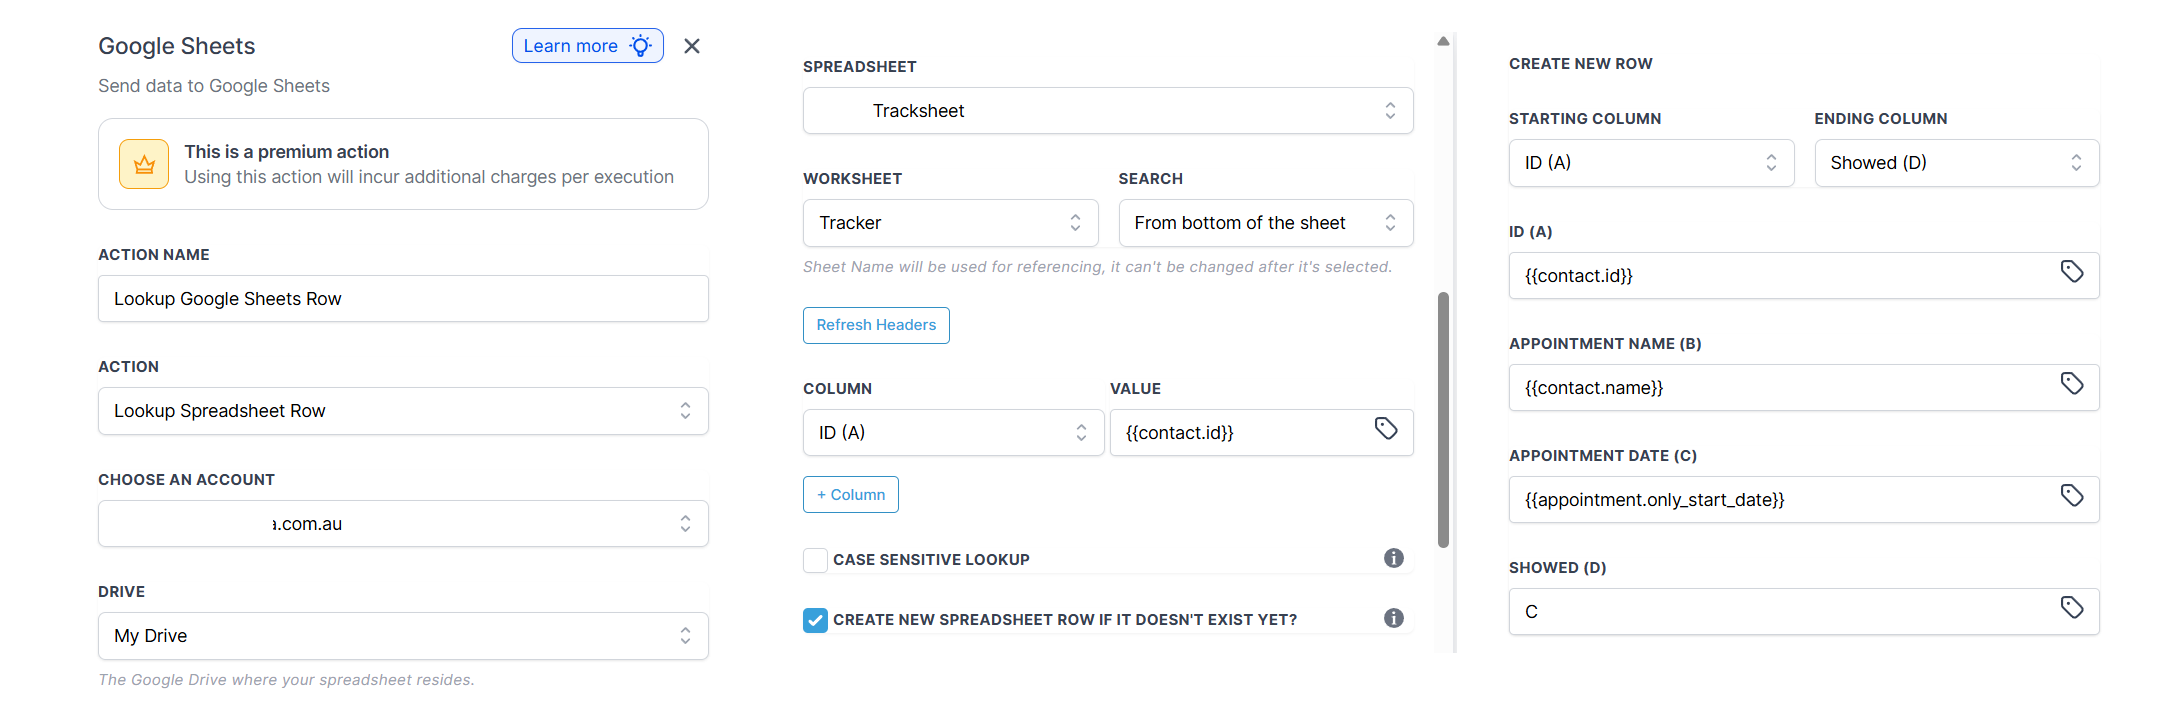
Many GHL users know how to create a new Google Sheets row, but fewer people know how to use the lookup row feature properly.
Without it, every workflow event could create another row for the same contact: one row when the appointment is booked, another when the person shows, another when the person becomes hot, and another when the sale closes.
With lookup row, the workflow searches the sheet by {{contact.id}}. If the contact already exists, GHL updates that row. If the contact does not exist, the workflow can create a new row first.
Implementation lesson: the spreadsheet structure matters. To keep the GHL workflow running smoothly, the contact ID column was kept as the first column in the sheet, and the tracker was set up without empty rows above the data table. This helped the lookup action consistently search the first column and update the correct contact row.
How the Workflow Works
The automation starts with several triggers. Some triggers listen for appointment changes, while others listen for pipeline stage changes.
After the trigger fires, the workflow performs the Google Sheets lookup. Then it uses conditional logic to decide which update path should run.
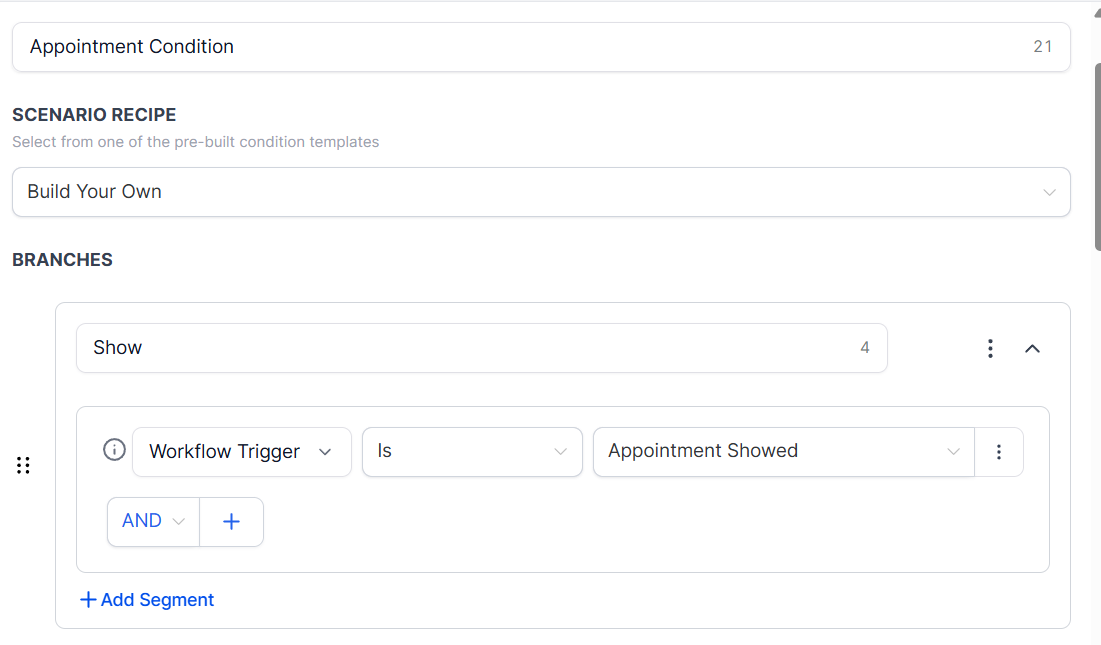
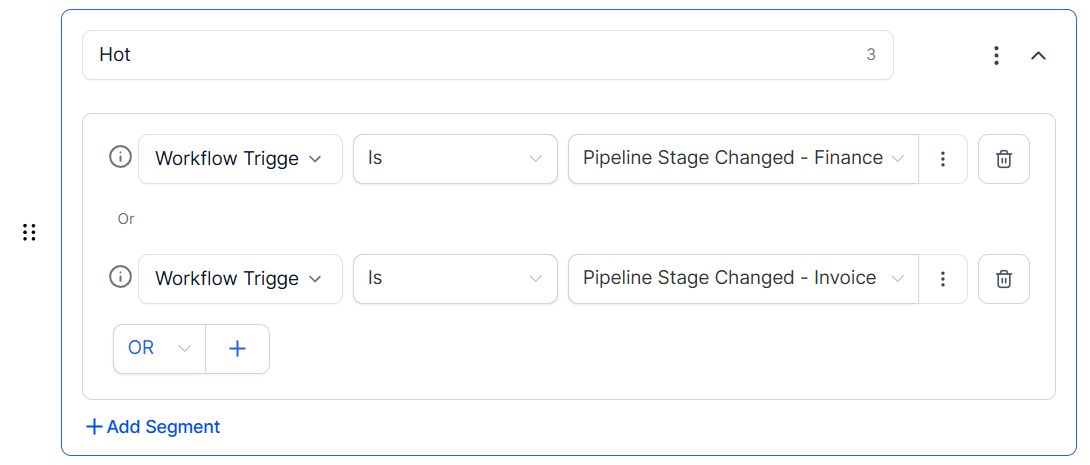
Each branch updates the matching row with the right values. For example, a no-show event can update the appointment status column. A closed-sale event can update close date, contract value, payment method, dialler, and setter.
Dashboard and Commission Reporting Layer
Once the workflow sends clean data into Google Sheets, the next layer is reporting.
The sheet can become the base for a dashboard that answers the questions marketing agencies care about: how many appointments each rep generated, how many showed, how many deals closed, which setter influenced the most revenue, how much cash was collected upfront, and how much commission is owed.
For commission calculations, the tracker can support commission based on contract value, cash collected upfront, different rates by rep or deal type, split commission between setter and closer, commission only after payment is collected, and exclusions for refunds or cancelled deals.
Formula layer: Google Sheets formulas were added to calculate commissions automatically. Instead of writing formulas manually into every new row, the sheet used array formulas so commission calculations expand as new contacts and sales records are added by the GHL workflow.
For ad spend reporting, the dashboard can calculate revenue divided by ad spend, cash collected divided by ad spend, cost per booked appointment, cost per showed appointment, cost per closed deal, and profit after ad spend.
This is where a simple automation becomes a real management tool. The workflow captures the events. The spreadsheet structures the data. The dashboard turns that data into decisions.
Proof: Execution Logs and Google Sheets Output
The workflow was tested through GoHighLevel's execution logs to confirm that the lookup and update steps were running correctly.
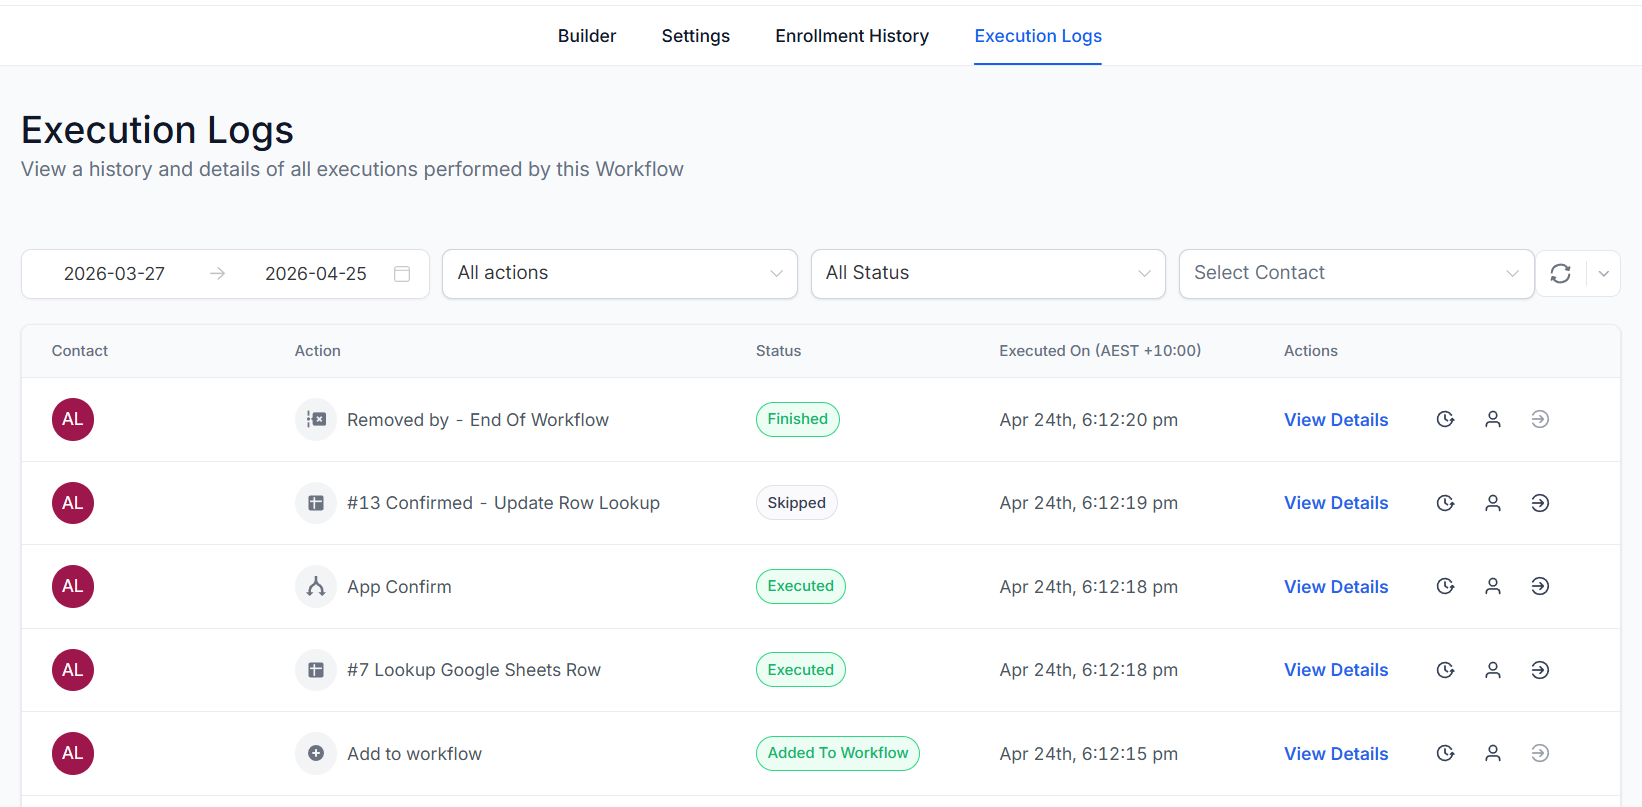
The final output is visible in Google Sheets. Rows are updated with appointment statuses, pipeline values, close dates, contract value, cash upfront, payment method, dialler, and setter fields.
That proof matters because the value of an automation is not just the workflow diagram. The value is whether the right numbers land in the right place, reliably enough to support reporting and payment decisions.
Business Value for Marketing Agencies
This project is a strong example of how spreadsheet automation can support agency operations without overcomplicating the tech stack.
For the agency, the automation can reduce manual admin and improve reporting quality. For the sales team, it creates cleaner visibility into appointment and deal progress. For managers, it creates a foundation for rep dashboards, commission tracking, and performance reviews.
For owners, it makes ad spend accountability easier because revenue and campaign costs can be compared inside the same reporting system. The biggest win is that the team can keep using tools they already understand: GoHighLevel and Google Sheets.
Common Questions
Why not just export reports from GoHighLevel?
Exports can be useful for one-off reviews, but they do not solve recurring reporting. This workflow updates the tracker as events happen, which gives the agency cleaner data for weekly dashboards, rep scorecards, and commission calculations.
Why use Google Sheets instead of a full BI tool?
For this use case, Google Sheets was the fastest practical reporting layer. The team already understood it, commission formulas could be adjusted easily, and dashboard logic could be built without forcing the agency into a heavier platform before it was needed.
What made the lookup row feature so important?
Lookup row made it possible to update the same contact record over time. Without it, each appointment or pipeline event could create duplicate rows, which would make commission reporting and sales dashboards unreliable.
Can this work with Excel too?
Yes. The same logic can be adapted for Excel-based reporting, either by syncing the Google Sheet into Excel, using Power Query, or building a separate Excel dashboard from exported or connected CRM data.
Can ad spend be included?
Yes. Ad spend can be added manually, imported from ad platforms, or connected through another automation. Once sales revenue and ad spend are in the same reporting model, the dashboard can calculate return on ad spend, cost per appointment, cost per sale, and profit after ad spend.
Can commissions update automatically?
Yes. The sheet can use array formulas so commission calculations automatically fill down as the workflow adds new rows or updates existing sales records. This avoids manual formula copying and keeps rep commission totals current.