Every multi-location reporting problem starts with a question that sounds trivial: how many leads did we get last month?
Run one GoHighLevel sub-account and there is one answer. Run twelve and there are thirteen: one per location, plus the number somebody assembles by hand each month. The thirteenth gets argued about, because nobody can trace it back to a screen.
That argument is the actual subject here, and it is not a dashboard problem. An owner wants one number they can act on. A location manager wants their own number, at a grain fine enough to act on today. Build for the first and you destroy what the second needed; build for the second and the first is back in a spreadsheet.
Why is rolling up GoHighLevel sub-account data hard?
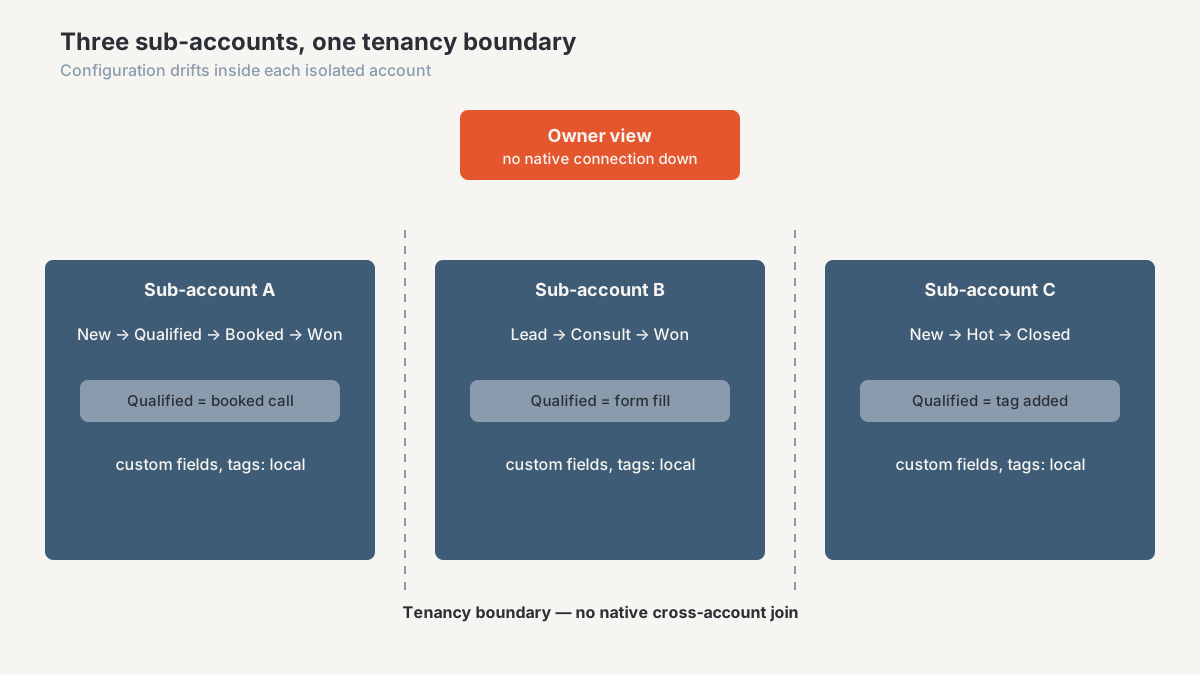
The sub-account is a tenancy boundary, and that is the right design decision. Location A's staff should not see Location B's contacts. Everything awkward about reporting follows from that isolation.
Reporting lives inside the boundary. Dashboards, pipeline views and attribution reports are scoped to whichever location you are standing in, and the agency level gives you a roster and some platform counts, not a metric layer spanning locations. Comparing two locations means switching context, looking, remembering, switching back. Fine at three, unworkable at thirty.
Configuration also drifts. Custom fields, pipelines, stages and tags are objects inside each sub-account, so even locations built from the same snapshot diverge within a quarter: a manager renames a stage, a new hire invents a tag, someone adds a pipeline for a promotion and never deletes it. “Qualified” in Location A now means a booked consultation; in Location C it means a form fill. Same label, different meaning, and summing them produces a number that means nothing.
And there is no shared join key. Contact and opportunity IDs are unique inside their own location, and nothing natively links one person across two sub-accounts. Any cross-location analysis has to invent that key and keep applying it as locations come online.
None of this is a bug. It is the cost of tenant isolation, and your rollup pays it somewhere: manually every month, or once in a data layer. Most estates default to manual, which people on GoHighLevel's public ideas board and in review commentary describe as “hours of manual work each month”.
What breaks when you sum metrics across locations?
Even with extraction solved and every location's data in one table, half of what people ask for cannot be added together.
Rates and ratios that can't just be added
Counts are additive. Leads, calls booked, opportunities created, deals won: add them and the total is true.
Rates are not. Average a 40% conversion rate at a location with 20 leads against a 10% rate at a location with 800, and the honest group figure is not 25%. It lands near 10.7%, because the large location dominates. Unweighted averages of rates are the most common failure I see in hand-built rollups, and the wrong answer always looks reasonable.
The fix is a rule rather than a formula: never store a rate, store its numerator and denominator. The table holds leads and conversions per location per period, and the rate gets computed at display time. Roll up to the group and both parts roll up with it, so the rate comes out right by construction. Cost per lead works the same way: store spend, store leads, never store CPL. Save a ratio into a row and somebody will eventually aggregate it.
A second-order version of this causes real arguments. A group rate can move opposite to every location inside it: if a low-converting location grows fast, group conversion falls even when all twelve locations improved. Anyone reporting to a franchisor needs a same-store comparison beside the headline, or they will spend the meeting defending a number that is not measuring what the owner thinks.
Duplicate contacts across shared campaigns
The quieter breakage is one human being counted twice.
It happens wherever locations share demand. A brand-level campaign points at one funnel, the lead picks a location on the form, and lands in one sub-account. Two weeks later the same person enquires about a different branch and lands in another. Two records, two location IDs, one person. Counts inflate, and cost per lead understates because the denominator grew. There is no shared dedupe: inside one location GoHighLevel matches on email or phone, and across locations there is nothing to match against.
Handling it takes three decisions made explicitly, before anything gets built. First, what identifies a person: normalised email, normalised phone in E.164 format, or a hash of both. Normalisation matters more than people expect, since the same number arrives as 07700 900123, +447700900123 and 447700900123 from three sources. Second, which location owns a duplicate: first touch, last touch, or the one that produced revenue. There is no universally right answer, only the wrong one of leaving it undefined so every report picks differently. Third, what the group number counts: distinct people at group level, attributed records below.
The group total will then not equal the sum of the locations, and that is correct. A rollup whose parts sum exactly to the whole is easy to explain and quietly wrong.
What does a franchisor or multi-location owner actually need to see?
Almost never the total. Watch an owner work with a report and the real jobs turn out to be comparison and exception.
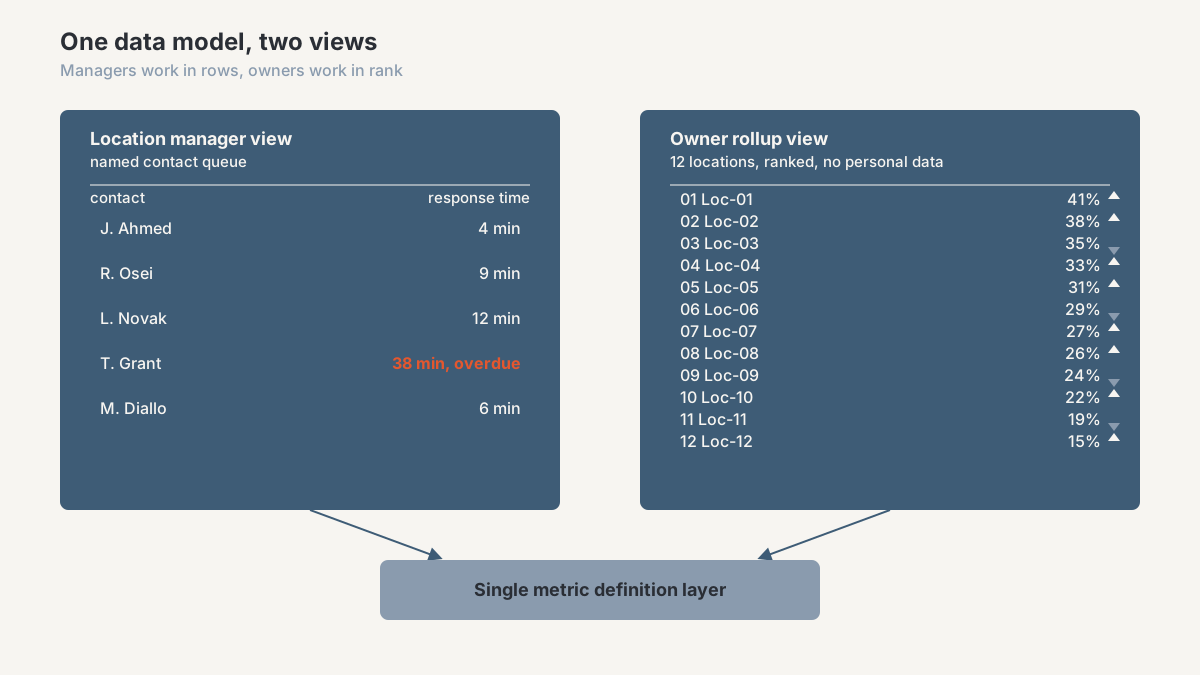
They want locations ranked on the two or three metrics that drive the business, with definitions guaranteed identical, because rank means nothing if “Qualified” differs by row. They want same-store comparison, since a location open eight months does not belong in a straight ranking against one open six years. They want the three locations that moved past a threshold, not twelve tiles. And they want leading indicators like speed to first contact and show rate, which say where a problem is forming, while revenue only reports what already happened.
What they do not need is a lower-fidelity copy of the operational dashboard, which lands too coarse to act on and too detailed to scan.
What does a location manager need that the rollup hides?
The mirror image, and this is where franchise reporting projects lose the field.
A manager works in named rows and in hours. They need this lead, who came in at 9:40 and has not been called, in a queue that belongs to them. They need to know that one of their three setters answers twice as slowly as the others, and they need last week's no-shows by name so somebody can ring them.
Aggregation strips identity. That is what aggregation is for, and it is why a monthly group dashboard is operationally useless at a location. The failure I would expect in most estates is not a missing group view, but one that got built and then quietly ignored by everyone below the owner.
So the rollup is a second consumer of the same modelled data, not a replacement for the first: one definition layer, two presentations. Managers keep working inside GoHighLevel at row level, which is what it is genuinely good at.
How do you build a rollup that works for both views?
Build order matters more than tool choice, and the first artefact is not a dashboard. It is a written definition of every metric you intend to report: exact name, plain-English definition, which objects and stages it derives from in each location, numerator and denominator if it is a rate, its timezone, and how it treats duplicates. That takes an afternoon, and skipping it is why rollup projects get rebuilt within a year.
Next to it you need a stage map: one row per location, one column per canonical stage. Location C's “Contract Sent” maps to canonical “Proposal”. Location F has no equivalent, and the map records that explicitly instead of leaving a blank someone later reads as zero. When a location renames a stage you update one row of the map rather than rebuilding a report.
Only then does the tooling question have a sensible answer, and it turns on how many locations you have and how far back you need to see.
Sheets-based rollup for a handful of locations
Up to roughly ten locations, reporting monthly or weekly with no serious history requirement, a spreadsheet layer is the honest answer, and any competent operator can audit it.
The shape that works is a scheduled pull per location into one long-format table, one row per location per period per metric, appended rather than overwritten. Long format is what lets a thirteenth location join without a rebuild. The stage map lives on its own tab, referenced by lookup and never hard-coded into formulas. Numerators and denominators are stored columns; rates are computed columns. Every append carries a snapshot date, so you can still tell what the report said in March after GoHighLevel's view of March has changed underneath you.
That last part is not paranoia. Overwritten history is a documented weakness of the native reporting, and I wrote it up in Your GHL Reporting Is Lying to You alongside export truncation and inconsistent metric definitions. Each gets worse per sub-account. For the mechanics of a Sheets feed, the GHL to Google Sheets workflow case shows one at single-agency scale.
The spreadsheet stops working when the pull takes long enough that people quietly stop trusting the refresh, when you need daily grain across a year of history, or when the exports themselves become the bottleneck. Practitioners describe GoHighLevel's raw exports as “not ready for direct use”, a polite way of saying the transformation cost recurs every refresh.
BI/warehouse rollup for larger multi-location estates
Past ten or so locations, or as soon as you need daily grain, retained history, or GoHighLevel combined with ad spend and payment data, the spreadsheet becomes the expensive option.
The architecture is unglamorous. Extract per location through the API on a schedule, into raw landing tables that keep the location ID on every row and never get edited by hand. Model on top: normalise, apply the stage map, deduplicate identity, stamp one timezone, and materialise fact tables at the grain you report on. Then serve from a single semantic layer where each metric is defined once, with row-level security so a manager only sees their own location.
What this buys that no in-platform option can is durable history: the warehouse keeps what a stage transition looked like on the day it happened, whatever the CRM does with it afterwards. The extraction half is in Export GoHighLevel Data to Supabase; the modelling and serving layers are what dashboards and analytics and data solutions deal with.
That filter lets one build serve both audiences. Scoped to the viewer's location the model is the location dashboard; unscoped it is the owner's rollup.
One caveat, stated rather than implied: ChromiumData has no published multi-location rollup case yet. The closest documented evidence is agency data ops work, covering GoHighLevel pipeline cleanup, workflow audits and reporting feeds at single-agency scale. That is adjacent, not identical.
How much manual work does this replace?
I am not going to give you a percentage, because I would be making it up.
The arithmetic takes ten minutes: count the locations, count the metrics somebody copies by hand each cycle, multiply by cycles per year, then add the time spent reconciling the versions that disagree. The reconciling usually costs more than the copying, and it is the part nobody logs.
The public pain language points the same way. “Hours of manual work each month” is how multi-client reporting gets described on GoHighLevel's ideas board and in review commentary, and “custom reports are not truly custom” is how the workaround gets described. Neither is a complaint about a missing button. Both describe a layer that has to exist somewhere and does not exist in the product.
Frequently asked questions
Can GoHighLevel natively combine reporting across sub-accounts?
Not in the way multi-location owners mean it. The agency level gives you a roster and some platform-level counts, but no native layer reconciles differing pipelines, stages and custom fields into comparable metrics. Anything past a headcount of locations needs manual assembly or an external data layer, so check the current feature set before planning around it.
How do you compare conversion rate fairly across locations of different sizes?
Store numerators and denominators separately and compute the rate at display time, so group figures are volume-weighted instead of an average of averages. Then add context: compare each location against its own prior period, and show lead volume next to the rate so nobody reads a 60% conversion on twelve leads as a success story.
What's the difference between a rollup dashboard and a franchise reporting system?
A rollup dashboard aggregates numbers that already exist. A franchise reporting system also governs the definitions: a canonical stage map, enforced field standards, a metric dictionary, and a process for onboarding a location without breaking the report. The governance is what stops the dashboard decaying six months in.
Does each location need its own GoHighLevel sub-account, or can they share one?
Separate sub-accounts make sense when locations have their own staff, need data isolation, or run their own calendars and phone numbers, which covers most franchise setups. A shared sub-account with location as a field is simpler to report on and fine for a few locations under one team, but it gives you no real access separation and gets painful to unwind. Decide the operating model first.
How do you handle a lead that touches more than one location?
Decide the ownership rule before you build the report: first touch, last touch, or the revenue-producing location. Deduplicate on normalised email and phone in the model layer, keep every touch against its own location, and report distinct people at group level while locations keep their attributed counts. Expect the group total to sit below the sum of the locations, and treat the gap as a measure of shared demand.
Get your multi-location rollup mapped
If you are running several GoHighLevel sub-accounts and assembling the group view by hand, the first useful step is a map: what each location stores, where the definitions have diverged, and which metrics are being summed that should not be.
That is what the agency CRM and reporting diagnostic produces: the stage map, the metric definitions, the duplicate-identity picture across your locations, and a recommendation on whether a spreadsheet layer or a warehouse fits your estate.
Book the reporting diagnostic and bring the sub-account list.
Related reading: why your GoHighLevel numbers don't match GA4 and your ad platforms.
About the author. Ahmed Abdelkhalek is a Data Automation and Reporting Consultant and the founder of ChromiumData, a founder-led consultancy building reporting and integration systems for marketing agencies and multi-location operators. He works with clients directly from diagnosis through delivery. More on his author page.